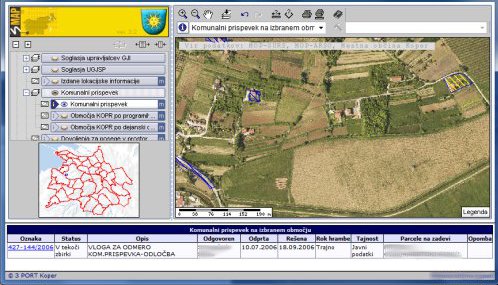
Public utilities charge
The Public utilities charge graphic layer shows an area of plots (one or more) for which applications to assess the public utility charge were submitted.
Layer creation
The graphic layer is created automatically based on data which is included in the VOPI system for the application type in question. The graphic layer refresh frequency is settable (the daily data transfer is default).
Plots are included in space for the state of DKN data, which is valid (accessible) on the date of the application creation.
Notifying the person responsible for the layer
In case of irregularities in the entered data, which can influence the creation and display of the graphic layer (e.g. a plot that was recorded upon opening a case in the VOPI system does not correspond to any plot in the plot database and as such cannot be displayed in space or in the graphic layer), it is possible to inform the person responsible (e.g. the office clerks responsible for the layer) with the intention to eliminate the irregularity. When the office clerk corrects the information in the VOPI system, the correction will be automatically transferred into the graphic layer at the next transfer or creation of the layer. Notifications are possible by e-mail and/or in the form of SMS messages.
Display of the “Public utilities charge” graphic layer in the 3MAP viewer


